Whistling Kite
Haliastur sphenurus
ABR description
The following is extracted from the Annual Bird Report for the twelve months to June 2017.
Uncommon, breeding resident
Seen throughout the region, often near bodies of water or wetlands.
General: 160 records, from 35 widespread grid cells, though 46% of them came from JWNR. Numbers ranged from 1 4 birds, with 4/24 Sep Wet Lagoon S02 (AnF1). Recorded throughout the year, with most records falling in summer (29%) and autumn (34%). However, the reporting rate of 1.1% was well below the long-term average of 1.6%. 2 breeding records of the one event: br/4 Sep and on/24 Sep Wet Lagoon GrS02 (AnF1). There have been breeding records for this species in 12 of the previous 30 years
GBS: One record of a single bird, 21 Aug Page GrJ12 (AlB1). The species has never been a common garden bird, with the highest number of records 5, in 2004.

Abundance
Abundance is the average number of birds of that species per survey. Where the species was observed (presence recorded) but the number of birds seen was not recorded, this is treated as a count of zero.
Abundance by year
This chart shows the abundance of Whistling Kite between 1982 and 2017. 
Abundance by month
This chart shows the monthly abundance of Whistling Kite. The blue lines show the abundance for the twelve months to June 2017 and the bars show the average abundance for the period 1982 to 2017. 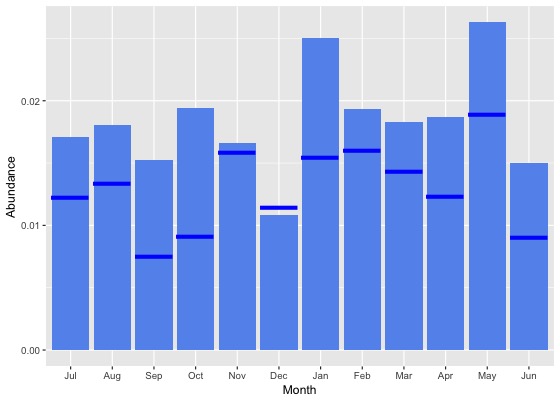
Abundance by season
This chart shows the seasonal abundance of Whistling Kite. The blue lines show the seasonal abundance for the twelve months to June 2017 and the bars show the average seasonal abundance for the period 1982 to 2017. 
Abundance data
| Month | Season | ||||||||||||||||||
|---|---|---|---|---|---|---|---|---|---|---|---|---|---|---|---|---|---|---|---|
| Period | Jul | Aug | Sep | Oct | Nov | Dec | Jan | Feb | Mar | Apr | May | Jun | Winter | Spring | Summer | Autumn | All | ||
| All years | |||||||||||||||||||
| All | 0.0 | 0.0 | 0.0 | 0.0 | 0.0 | 0.0 | 0.0 | 0.0 | 0.0 | 0.0 | 0.0 | 0.0 | 0.0 | 0.0 | 0.0 | 0.0 | 0.0 | ||
| Previous years | |||||||||||||||||||
| All previous years | 0.0 | 0.0 | 0.0 | 0.0 | 0.0 | 0.0 | 0.0 | 0.0 | 0.0 | 0.0 | 0.0 | 0.0 | 0.0 | 0.0 | 0.0 | 0.0 | 0.0 | ||
| Previous 30 years | 0.0 | 0.0 | 0.0 | 0.0 | 0.0 | 0.0 | 0.0 | 0.0 | 0.0 | 0.0 | 0.0 | 0.0 | 0.0 | 0.0 | 0.0 | 0.0 | 0.0 | ||
| Previous 20 years | 0.0 | 0.0 | 0.0 | 0.0 | 0.0 | 0.0 | 0.0 | 0.0 | 0.0 | 0.0 | 0.0 | 0.0 | 0.0 | 0.0 | 0.0 | 0.0 | 0.0 | ||
| 10 year groups | |||||||||||||||||||
| [2007,2017) | 0.0 | 0.0 | 0.0 | 0.0 | 0.0 | 0.0 | 0.0 | 0.0 | 0.0 | 0.0 | 0.0 | 0.0 | 0.0 | 0.0 | 0.0 | 0.0 | 0.0 | ||
| [1997,2007) | 0.0 | 0.0 | 0.0 | 0.0 | 0.0 | 0.0 | 0.0 | 0.0 | 0.0 | 0.0 | 0.0 | 0.0 | 0.0 | 0.0 | 0.0 | 0.0 | 0.0 | ||
| [1987,1997) | 0.0 | 0.0 | 0.0 | 0.0 | 0.0 | 0.0 | 0.0 | 0.0 | 0.0 | 0.0 | 0.0 | 0.0 | 0.0 | 0.0 | 0.0 | 0.0 | 0.0 | ||
| 5 year groups | |||||||||||||||||||
| [2012,2017) | 0.0 | 0.0 | 0.0 | 0.0 | 0.0 | 0.0 | 0.0 | 0.0 | 0.0 | 0.0 | 0.0 | 0.0 | 0.0 | 0.0 | 0.0 | 0.0 | 0.0 | ||
| [2007,2012) | 0.0 | 0.0 | 0.0 | 0.0 | 0.0 | 0.0 | 0.0 | 0.0 | 0.0 | 0.0 | 0.0 | 0.0 | 0.0 | 0.0 | 0.0 | 0.0 | 0.0 | ||
| [2002,2007) | 0.0 | 0.0 | 0.0 | 0.0 | 0.0 | 0.0 | 0.0 | 0.0 | 0.0 | 0.0 | 0.0 | 0.0 | 0.0 | 0.0 | 0.0 | 0.0 | 0.0 | ||
| [1997,2002) | 0.0 | 0.0 | 0.0 | 0.0 | 0.0 | 0.0 | 0.0 | 0.0 | 0.0 | 0.0 | 0.0 | 0.0 | 0.0 | 0.0 | 0.0 | 0.0 | 0.0 | ||
| [1992,1997) | 0.1 | 0.0 | 0.0 | 0.0 | 0.0 | 0.0 | 0.1 | 0.0 | 0.1 | 0.0 | 0.0 | 0.0 | 0.0 | 0.0 | 0.1 | 0.0 | 0.0 | ||
| [1987,1992) | 0.0 | 0.0 | 0.0 | 0.0 | 0.0 | 0.0 | 0.0 | 0.0 | 0.0 | 0.0 | 0.0 | 0.0 | 0.0 | 0.0 | 0.0 | 0.0 | 0.0 | ||
| Year | |||||||||||||||||||
| 2017 | 0.0 | 0.0 | 0.0 | 0.0 | 0.0 | 0.0 | 0.0 | 0.0 | 0.0 | 0.0 | 0.0 | 0.0 | 0.0 | 0.0 | 0.0 | 0.0 | 0.0 | ||
| 2016 | 0.0 | 0.0 | 0.0 | 0.0 | 0.0 | 0.0 | 0.0 | 0.0 | 0.0 | 0.0 | 0.0 | 0.0 | 0.0 | 0.0 | 0.0 | 0.0 | 0.0 | ||
| 2015 | 0.0 | 0.0 | 0.0 | 0.0 | 0.0 | 0.0 | 0.0 | 0.0 | 0.0 | 0.0 | 0.0 | 0.0 | 0.0 | 0.0 | 0.0 | 0.0 | 0.0 | ||
| 2014 | 0.0 | 0.1 | 0.1 | 0.1 | 0.0 | 0.0 | 0.1 | 0.1 | 0.0 | 0.1 | 0.1 | 0.0 | 0.0 | 0.1 | 0.1 | 0.0 | 0.1 | ||
| 2013 | 0.0 | 0.0 | 0.0 | 0.0 | 0.0 | 0.0 | 0.0 | 0.0 | 0.0 | 0.1 | 0.1 | 0.0 | 0.0 | 0.0 | 0.0 | 0.1 | 0.0 | ||
| 2012 | 0.0 | 0.0 | 0.0 | 0.0 | 0.0 | 0.0 | 0.0 | 0.0 | 0.0 | 0.0 | 0.0 | 0.0 | 0.0 | 0.0 | 0.0 | 0.0 | 0.0 | ||
| 2011 | 0.0 | 0.0 | 0.0 | 0.0 | 0.0 | 0.0 | 0.0 | 0.0 | 0.0 | 0.0 | 0.0 | 0.0 | 0.0 | 0.0 | 0.0 | 0.0 | 0.0 | ||
| 2010 | 0.0 | 0.0 | 0.1 | 0.0 | 0.0 | 0.0 | 0.0 | 0.0 | 0.0 | 0.0 | 0.0 | 0.0 | 0.0 | 0.0 | 0.0 | 0.0 | 0.0 | ||
| 2009 | 0.0 | 0.0 | 0.0 | 0.0 | 0.0 | 0.0 | 0.0 | 0.0 | 0.0 | 0.0 | 0.0 | 0.0 | 0.0 | 0.0 | 0.0 | 0.0 | 0.0 | ||
| 2008 | 0.0 | 0.0 | 0.0 | 0.0 | 0.0 | 0.0 | 0.1 | 0.1 | 0.0 | 0.0 | 0.1 | 0.0 | 0.0 | 0.0 | 0.0 | 0.0 | 0.0 | ||
| 2007 | 0.0 | 0.0 | 0.0 | 0.0 | 0.0 | 0.0 | 0.0 | 0.0 | 0.0 | 0.0 | 0.1 | 0.0 | 0.0 | 0.0 | 0.0 | 0.0 | 0.0 | ||
| 2006 | 0.0 | 0.0 | 0.0 | 0.0 | 0.0 | 0.0 | 0.1 | 0.0 | 0.0 | 0.0 | 0.1 | 0.0 | 0.0 | 0.0 | 0.0 | 0.1 | 0.0 | ||
| 2005 | 0.1 | 0.0 | 0.0 | 0.0 | 0.0 | 0.0 | 0.1 | 0.0 | 0.0 | 0.0 | 0.0 | 0.0 | 0.0 | 0.0 | 0.0 | 0.0 | 0.0 | ||
| 2004 | 0.0 | 0.0 | 0.0 | 0.0 | 0.0 | 0.0 | 0.0 | 0.0 | 0.0 | 0.0 | 0.0 | 0.0 | 0.0 | 0.0 | 0.0 | 0.0 | 0.0 | ||
| 2003 | 0.0 | 0.0 | 0.0 | 0.1 | 0.0 | 0.0 | 0.0 | 0.0 | 0.0 | 0.0 | 0.0 | 0.0 | 0.0 | 0.0 | 0.0 | 0.0 | 0.0 | ||
| 2002 | 0.0 | 0.0 | 0.0 | 0.0 | 0.0 | 0.0 | 0.0 | 0.0 | 0.0 | 0.0 | 0.0 | 0.0 | 0.0 | 0.0 | 0.0 | 0.0 | 0.0 | ||
| 2001 | 0.0 | 0.0 | 0.0 | 0.0 | 0.0 | 0.0 | 0.0 | 0.0 | 0.0 | 0.0 | 0.0 | 0.0 | 0.0 | 0.0 | 0.0 | 0.0 | 0.0 | ||
| 2000 | 0.0 | 0.0 | 0.0 | 0.0 | 0.0 | 0.0 | 0.0 | 0.0 | 0.0 | 0.0 | 0.0 | 0.0 | 0.0 | 0.0 | 0.0 | 0.0 | 0.0 | ||
| 1999 | 0.0 | 0.0 | 0.0 | 0.0 | 0.0 | 0.0 | 0.0 | 0.0 | 0.0 | 0.0 | 0.0 | 0.0 | 0.0 | 0.0 | 0.0 | 0.0 | 0.0 | ||
| 1998 | 0.0 | 0.0 | 0.0 | 0.0 | 0.0 | 0.0 | 0.0 | 0.1 | 0.1 | 0.0 | 0.0 | 0.1 | 0.0 | 0.0 | 0.0 | 0.0 | 0.0 | ||
| 1997 | 0.0 | 0.0 | 0.0 | 0.0 | 0.0 | 0.0 | 0.0 | 0.0 | 0.0 | 0.0 | 0.0 | 0.0 | 0.0 | 0.0 | 0.0 | 0.0 | 0.0 | ||
| 1996 | 0.1 | 0.0 | 0.0 | 0.0 | 0.0 | 0.0 | 0.0 | 0.0 | 0.0 | 0.0 | 0.1 | 0.0 | 0.0 | 0.0 | 0.0 | 0.0 | 0.0 | ||
| 1995 | 0.0 | 0.0 | 0.0 | 0.0 | 0.0 | 0.1 | 0.0 | 0.0 | 0.1 | 0.0 | 0.0 | 0.0 | 0.0 | 0.0 | 0.0 | 0.1 | 0.0 | ||
| 1994 | 0.0 | 0.0 | 0.0 | 0.0 | 0.0 | 0.0 | 0.2 | 0.0 | 0.0 | 0.0 | 0.0 | 0.1 | 0.0 | 0.0 | 0.1 | 0.0 | 0.0 | ||
| 1993 | 0.1 | 0.0 | 0.0 | 0.1 | 0.0 | 0.0 | 0.1 | 0.0 | 0.0 | 0.0 | 0.0 | 0.0 | 0.0 | 0.0 | 0.1 | 0.0 | 0.0 | ||
| 1992 | 0.0 | 0.0 | 0.1 | 0.0 | 0.0 | 0.0 | 0.1 | 0.2 | 0.1 | 0.0 | 0.1 | 0.1 | 0.1 | 0.0 | 0.1 | 0.1 | 0.1 | ||
| 1991 | 0.0 | 0.0 | 0.0 | 0.0 | 0.0 | 0.0 | 0.0 | 0.0 | 0.0 | 0.0 | 0.0 | 0.0 | 0.0 | 0.0 | 0.0 | 0.0 | 0.0 | ||
| 1990 | 0.0 | 0.0 | 0.0 | 0.0 | 0.0 | 0.0 | 0.0 | 0.0 | 0.0 | 0.0 | 0.0 | 0.1 | 0.0 | 0.0 | 0.0 | 0.0 | 0.0 | ||
| 1989 | 0.0 | 0.0 | 0.0 | 0.0 | 0.0 | 0.0 | 0.0 | 0.0 | 0.0 | 0.0 | 0.0 | 0.0 | 0.0 | 0.0 | 0.0 | 0.0 | 0.0 | ||
| 1988 | 0.0 | 0.0 | 0.0 | 0.0 | 0.0 | 0.0 | 0.0 | 0.0 | 0.0 | 0.0 | 0.0 | 0.0 | 0.0 | 0.0 | 0.0 | 0.0 | 0.0 | ||
| 1987 | 0.0 | 0.0 | 0.0 | 0.0 | 0.0 | 0.0 | 0.0 | 0.0 | 0.0 | 0.0 | 0.0 | 0.0 | 0.0 | 0.0 | 0.0 | 0.0 | 0.0 | ||
| 1986 | 0.0 | 0.0 | 0.0 | 0.1 | 0.1 | 0.0 | 0.2 | 0.1 | 0.2 | 0.1 | 0.0 | 0.0 | 0.0 | 0.0 | 0.1 | 0.1 | 0.1 | ||
| 1985 | 0.0 | 0.0 | 0.0 | 0.0 | 0.1 | 0.0 | 0.1 | 0.1 | 0.0 | 0.0 | 0.0 | 0.0 | 0.0 | 0.0 | 0.0 | 0.0 | 0.0 | ||
| 1984 | 0.0 | 0.0 | 0.0 | 0.0 | 0.0 | 0.0 | 0.0 | 0.0 | 0.0 | 0.0 | 0.1 | 0.0 | 0.0 | 0.0 | 0.0 | 0.0 | 0.0 | ||
| 1983 | 0.0 | 0.1 | 0.0 | 0.1 | 0.0 | 0.0 | 0.3 | 0.0 | 0.0 | - | 0.0 | 0.0 | 0.0 | 0.0 | 0.1 | 0.0 | 0.0 | ||
| 1982 | - | 0.2 | - | 0.0 | 0.0 | 0.0 | - | 0.0 | - | 0.0 | - | 0.1 | 0.1 | 0.0 | 0.0 | 0.0 | 0.0 | ||
Reporting rates
Reporting rate is the proportion of all surveys in which the species was present.
Reporting rate by year
This chart shows the reporting rate of Whistling Kite each year between 1982 and 2017. 
Reporting rate by month
This chart shows the reporting rate by month of Whistling Kite. The blue lines show the reporting rate for the twelve months to June 2017 and the bars show the average reporting rate for the period 1982 to 2017. 
Reporting rate by season
This chart shows the seasonal reporting rate of Whistling Kite. The blue lines show the seasonal reporting rate for the twelve months to June 2017 and the bars show the average seasonal reporting rate for the period 1982 to 2017. 
Reporting rate data
| Month | Season | ||||||||||||||||||
|---|---|---|---|---|---|---|---|---|---|---|---|---|---|---|---|---|---|---|---|
| Period | Jul | Aug | Sep | Oct | Nov | Dec | Jan | Feb | Mar | Apr | May | Jun | Winter | Spring | Summer | Autumn | All | ||
| All years | |||||||||||||||||||
| All | 1.6 | 1.6 | 1.3 | 1.8 | 1.6 | 1.0 | 1.8 | 1.5 | 1.4 | 1.7 | 2.2 | 1.3 | 1.5 | 1.6 | 1.4 | 1.7 | 1.5 | ||
| Previous years | |||||||||||||||||||
| All previous years | 1.7 | 1.7 | 1.4 | 1.9 | 1.7 | 1.0 | 1.9 | 1.5 | 1.5 | 1.7 | 2.2 | 1.4 | 1.6 | 1.7 | 1.5 | 1.8 | 1.6 | ||
| Previous 30 years | 1.7 | 1.7 | 1.4 | 1.9 | 1.6 | 1.0 | 1.9 | 1.5 | 1.4 | 1.7 | 2.2 | 1.4 | 1.6 | 1.7 | 1.4 | 1.7 | 1.6 | ||
| Previous 20 years | 1.6 | 1.7 | 1.3 | 1.8 | 1.7 | 1.0 | 1.9 | 1.5 | 1.2 | 1.6 | 2.3 | 1.2 | 1.5 | 1.6 | 1.4 | 1.6 | 1.5 | ||
| 10 year groups | |||||||||||||||||||
| [2007,2017) | 1.6 | 1.9 | 1.5 | 1.8 | 2.0 | 1.2 | 1.7 | 1.4 | 1.2 | 1.7 | 2.2 | 1.3 | 1.6 | 1.8 | 1.4 | 1.6 | 1.6 | ||
| [1997,2007) | 1.7 | 1.4 | 0.8 | 2.0 | 1.1 | 0.5 | 2.4 | 1.6 | 1.4 | 1.5 | 2.4 | 1.0 | 1.3 | 1.3 | 1.4 | 1.7 | 1.4 | ||
| [1987,1997) | 1.7 | 1.6 | 2.0 | 2.2 | 1.3 | 1.2 | 1.8 | 1.5 | 2.6 | 2.2 | 2.1 | 2.1 | 1.8 | 1.8 | 1.5 | 2.3 | 1.9 | ||
| 5 year groups | |||||||||||||||||||
| [2012,2017) | 1.8 | 2.0 | 1.4 | 1.8 | 2.1 | 1.5 | 1.6 | 1.4 | 1.2 | 1.9 | 2.4 | 1.5 | 1.7 | 1.8 | 1.5 | 1.8 | 1.7 | ||
| [2007,2012) | 1.2 | 1.4 | 1.8 | 1.8 | 1.6 | 0.6 | 1.9 | 1.5 | 1.0 | 1.0 | 1.8 | 1.0 | 1.2 | 1.8 | 1.2 | 1.2 | 1.4 | ||
| [2002,2007) | 2.4 | 2.3 | 1.2 | 2.8 | 1.9 | 0.7 | 3.6 | 2.3 | 1.8 | 2.1 | 4.4 | 1.2 | 1.9 | 2.0 | 2.0 | 2.5 | 2.1 | ||
| [1997,2002) | 0.6 | 0.4 | 0.3 | 0.8 | 0.1 | 0.2 | 1.1 | 0.9 | 0.8 | 0.6 | 0.0 | 0.8 | 0.6 | 0.4 | 0.7 | 0.5 | 0.6 | ||
| [1992,1997) | 3.7 | 2.3 | 2.8 | 3.4 | 1.4 | 2.6 | 3.8 | 2.5 | 3.9 | 3.2 | 3.5 | 2.5 | 2.8 | 2.5 | 3.1 | 3.5 | 3.0 | ||
| [1987,1992) | 0.8 | 1.3 | 1.6 | 1.5 | 1.3 | 0.5 | 0.7 | 1.1 | 1.9 | 1.6 | 1.4 | 1.8 | 1.3 | 1.4 | 0.8 | 1.6 | 1.3 | ||
| Year | |||||||||||||||||||
| 2017 | 1.1 | 1.1 | 0.4 | 0.9 | 1.1 | 1.1 | 1.2 | 1.3 | 1.3 | 1.2 | 1.8 | 0.8 | 1.0 | 0.8 | 1.2 | 1.4 | 1.1 | ||
| 2016 | 1.6 | 1.2 | 0.9 | 1.1 | 2.4 | 1.3 | 0.8 | 0.7 | 0.6 | 1.3 | 1.5 | 1.4 | 1.4 | 1.4 | 0.9 | 1.1 | 1.2 | ||
| 2015 | 2.8 | 2.9 | 1.2 | 2.2 | 2.8 | 1.8 | 1.2 | 0.6 | 0.8 | 0.9 | 2.3 | 1.2 | 2.1 | 2.0 | 1.2 | 1.3 | 1.6 | ||
| 2014 | 4.2 | 5.9 | 5.5 | 5.0 | 4.4 | 4.2 | 3.4 | 3.6 | 2.4 | 4.9 | 4.4 | 2.3 | 3.8 | 5.0 | 3.7 | 3.7 | 4.1 | ||
| 2013 | 0.5 | 0.9 | 0.2 | 0.8 | 0.8 | 0.9 | 3.0 | 2.6 | 2.6 | 4.0 | 5.0 | 3.2 | 1.7 | 0.6 | 2.1 | 3.6 | 1.9 | ||
| 2012 | 0.0 | 0.0 | 0.0 | 0.5 | 0.3 | 0.3 | 0.4 | 1.0 | 0.9 | 0.3 | 0.0 | 0.0 | 0.0 | 0.3 | 0.4 | 0.5 | 0.3 | ||
| 2011 | 1.6 | 0.0 | 1.2 | 0.0 | 0.0 | 0.0 | 0.6 | 0.5 | 0.0 | 0.0 | 0.0 | 0.0 | 0.3 | 0.3 | 0.3 | 0.0 | 0.2 | ||
| 2010 | 1.0 | 3.5 | 4.5 | 2.5 | 0.0 | 1.1 | 4.3 | 2.4 | 0.4 | 0.4 | 1.0 | 0.4 | 1.3 | 2.5 | 2.5 | 0.5 | 1.8 | ||
| 2009 | 0.7 | 0.0 | 0.0 | 1.3 | 3.6 | 0.0 | 0.7 | 1.7 | 0.9 | 1.2 | 0.8 | 0.5 | 0.4 | 1.5 | 0.7 | 1.0 | 1.0 | ||
| 2008 | 0.0 | 2.6 | 3.0 | 4.0 | 2.7 | 0.5 | 5.6 | 4.6 | 1.1 | 1.2 | 4.5 | 0.5 | 0.8 | 3.5 | 2.9 | 1.8 | 2.5 | ||
| 2007 | 3.3 | 0.9 | 0.4 | 0.7 | 1.4 | 1.3 | 0.4 | 0.0 | 3.0 | 2.6 | 4.9 | 3.6 | 3.0 | 0.7 | 0.7 | 3.2 | 1.7 | ||
| 2006 | 2.0 | 1.9 | 1.3 | 2.8 | 1.2 | 0.6 | 5.6 | 5.2 | 3.5 | 3.8 | 8.0 | 1.5 | 1.7 | 2.0 | 3.7 | 4.5 | 3.0 | ||
| 2005 | 5.9 | 0.9 | 1.1 | 3.9 | 1.4 | 0.8 | 5.0 | 0.0 | 2.2 | 1.1 | 5.5 | 0.0 | 1.8 | 2.0 | 1.9 | 2.9 | 2.2 | ||
| 2004 | 2.4 | 3.9 | 1.0 | 1.7 | 1.7 | 1.4 | 3.6 | 3.0 | 2.1 | 2.7 | 1.0 | 2.5 | 2.8 | 1.4 | 2.5 | 2.1 | 2.2 | ||
| 2003 | 2.6 | 2.9 | 2.5 | 5.7 | 4.6 | 1.3 | 3.7 | 2.2 | 0.4 | 2.3 | 3.9 | 1.9 | 2.4 | 4.2 | 2.2 | 1.9 | 2.7 | ||
| 2002 | 0.0 | 0.8 | 0.0 | 0.4 | 0.0 | 0.0 | 0.0 | 0.7 | 0.0 | 0.6 | 1.2 | 0.5 | 0.4 | 0.2 | 0.2 | 0.4 | 0.3 | ||
| 2001 | 0.9 | 0.0 | 0.0 | 0.0 | 0.0 | 0.0 | 0.0 | 0.0 | 0.0 | 0.5 | 0.0 | 0.0 | 0.3 | 0.0 | 0.0 | 0.1 | 0.1 | ||
| 2000 | 0.8 | 0.0 | 0.0 | 0.9 | 0.5 | 0.7 | 2.5 | 1.4 | 1.2 | 0.4 | 0.0 | 0.0 | 0.2 | 0.5 | 1.5 | 0.7 | 0.8 | ||
| 1999 | 0.0 | 2.1 | 1.1 | 1.3 | 0.0 | 0.0 | 0.0 | 0.0 | 0.5 | 0.0 | 0.0 | 0.5 | 0.9 | 0.8 | 0.0 | 0.2 | 0.4 | ||
| 1998 | 0.0 | 0.0 | 0.0 | 1.1 | 0.0 | 0.0 | 1.5 | 3.8 | 3.2 | 2.6 | 0.0 | 6.7 | 3.0 | 0.3 | 1.3 | 2.5 | 1.5 | ||
| 1997 | 0.0 | 0.0 | 0.9 | 1.3 | 0.0 | 0.0 | 2.0 | 1.8 | 0.0 | 1.8 | 0.0 | 0.0 | 0.0 | 0.7 | 0.9 | 1.0 | 0.6 | ||
| 1996 | 6.0 | 2.1 | 1.3 | 1.8 | 0.0 | 1.0 | 1.9 | 1.2 | 1.0 | 0.0 | 3.4 | 0.0 | 2.4 | 1.0 | 1.4 | 1.3 | 1.5 | ||
| 1995 | 2.2 | 3.9 | 1.0 | 3.7 | 0.9 | 2.3 | 1.8 | 0.0 | 7.1 | 4.0 | 3.9 | 0.0 | 2.2 | 2.1 | 1.5 | 5.0 | 2.7 | ||
| 1994 | 0.0 | 2.6 | 4.4 | 3.5 | 1.5 | 4.3 | 8.8 | 1.7 | 3.4 | 3.1 | 3.8 | 4.5 | 2.8 | 2.8 | 5.2 | 3.3 | 3.4 | ||
| 1993 | 6.1 | 1.3 | 1.6 | 6.7 | 4.5 | 4.3 | 6.1 | 0.0 | 1.2 | 5.0 | 1.3 | 1.4 | 2.6 | 4.4 | 3.9 | 2.3 | 3.2 | ||
| 1992 | 4.6 | 0.0 | 5.9 | 2.1 | 1.4 | 3.2 | 3.4 | 12.2 | 7.0 | 3.4 | 5.3 | 8.3 | 4.5 | 3.2 | 5.6 | 5.3 | 4.5 | ||
| 1991 | 0.8 | 0.0 | 1.2 | 1.0 | 0.0 | 0.0 | 1.8 | 0.0 | 1.6 | 3.4 | 4.9 | 0.0 | 0.4 | 0.7 | 0.6 | 3.3 | 1.1 | ||
| 1990 | 0.6 | 2.7 | 2.2 | 1.0 | 0.9 | 0.0 | 1.4 | 0.0 | 2.3 | 3.6 | 1.4 | 6.6 | 2.6 | 1.3 | 0.5 | 2.4 | 1.9 | ||
| 1989 | 1.0 | 0.9 | 0.4 | 2.3 | 1.5 | 0.4 | 1.1 | 1.5 | 3.9 | 2.1 | 1.3 | 2.4 | 1.3 | 1.5 | 1.0 | 2.5 | 1.5 | ||
| 1988 | 0.9 | 1.1 | 2.8 | 2.0 | 2.4 | 1.5 | 0.0 | 2.9 | 0.5 | 0.0 | 1.0 | 1.4 | 1.1 | 2.4 | 1.4 | 0.5 | 1.4 | ||
| 1987 | 0.0 | 0.0 | 1.6 | 0.8 | 0.6 | 0.0 | 0.5 | 0.0 | 1.4 | 1.2 | 0.9 | 0.5 | 0.4 | 1.0 | 0.2 | 1.2 | 0.8 | ||
| 1986 | 3.8 | 0.0 | 1.9 | 5.6 | 8.5 | 0.0 | 13.0 | 8.3 | 9.7 | 5.9 | 0.0 | 2.9 | 2.0 | 5.1 | 6.5 | 5.4 | 4.8 | ||
| 1985 | 0.0 | 0.0 | 0.0 | 2.3 | 3.5 | 1.7 | 12.5 | 5.9 | 0.0 | 0.0 | 0.0 | 0.0 | 0.0 | 2.1 | 3.5 | 0.0 | 1.7 | ||
| 1984 | 0.0 | 0.0 | 0.0 | 0.0 | 0.0 | 0.0 | 0.0 | 0.0 | 0.0 | 2.9 | 6.5 | 0.0 | 0.0 | 0.0 | 0.0 | 3.3 | 1.3 | ||
| 1983 | 0.0 | 8.3 | 0.0 | 7.7 | 0.0 | 0.0 | 16.7 | 0.0 | 0.0 | - | 0.0 | 0.0 | 3.4 | 3.7 | 3.3 | 0.0 | 3.0 | ||
| 1982 | - | 18.2 | - | 0.0 | 0.0 | 0.0 | - | 0.0 | - | 0.0 | - | 7.1 | 12.0 | 0.0 | 0.0 | 0.0 | 4.2 | ||
Breeding data
Breeding records by month
Number of breeding records by breeding code and month, 2017 and all years| Breeding code | Jul | Aug | Sep | Oct | Nov | Dec | Jan | Feb | Mar | Apr | May | Jun |
|---|---|---|---|---|---|---|---|---|---|---|---|---|
| 2017 | ||||||||||||
| Breeding (BLA code) | 0 | 0 | 0 | 0 | 0 | 0 | 0 | 0 | 0 | 0 | 0 | 0 |
| Carrying Food | 0 | 0 | 0 | 0 | 0 | 0 | 0 | 0 | 0 | 0 | 0 | 0 |
| Copulating | 0 | 0 | 0 | 0 | 0 | 0 | 0 | 0 | 0 | 0 | 0 | 0 |
| Display | 0 | 0 | 0 | 0 | 0 | 0 | 0 | 0 | 0 | 0 | 0 | 0 |
| Dependent young | 0 | 0 | 0 | 0 | 0 | 0 | 0 | 0 | 0 | 0 | 0 | 0 |
| Faecal sac | 0 | 0 | 0 | 0 | 0 | 0 | 0 | 0 | 0 | 0 | 0 | 0 |
| Inspecting hollow | 0 | 0 | 1 | 0 | 0 | 0 | 0 | 0 | 0 | 0 | 0 | 0 |
| Nest building | 0 | 0 | 0 | 0 | 0 | 0 | 0 | 0 | 0 | 0 | 0 | 0 |
| Nest with eggs | 0 | 0 | 0 | 0 | 0 | 0 | 0 | 0 | 0 | 0 | 0 | 0 |
| Nest with young | 0 | 0 | 0 | 0 | 0 | 0 | 0 | 0 | 0 | 0 | 0 | 0 |
| On/leaving nest | 0 | 0 | 1 | 0 | 0 | 0 | 0 | 0 | 0 | 0 | 0 | 0 |
| All years | ||||||||||||
| Breeding (BLA code) | 0 | 0 | 0 | 0 | 0 | 0 | 0 | 0 | 0 | 0 | 0 | 0 |
| Carrying Food | 0 | 0 | 0 | 0 | 0 | 0 | 0 | 0 | 0 | 0 | 0 | 0 |
| Copulating | 0 | 0 | 0 | 0 | 0 | 0 | 0 | 0 | 0 | 0 | 0 | 0 |
| Display | 0 | 0 | 0 | 1 | 0 | 0 | 0 | 0 | 0 | 0 | 0 | 0 |
| Dependent young | 0 | 0 | 0 | 1 | 0 | 0 | 1 | 0 | 0 | 0 | 0 | 0 |
| Faecal sac | 0 | 0 | 0 | 0 | 0 | 0 | 0 | 0 | 0 | 0 | 0 | 0 |
| Inspecting hollow | 0 | 0 | 1 | 1 | 0 | 0 | 0 | 0 | 0 | 0 | 0 | 0 |
| Nest building | 0 | 1 | 3 | 0 | 1 | 0 | 0 | 0 | 0 | 0 | 1 | 1 |
| Nest with eggs | 0 | 1 | 0 | 0 | 0 | 0 | 0 | 0 | 0 | 0 | 0 | 0 |
| Nest with young | 0 | 0 | 0 | 3 | 1 | 0 | 0 | 0 | 0 | 0 | 0 | 0 |
| On/leaving nest | 0 | 0 | 3 | 1 | 0 | 0 | 0 | 0 | 0 | 0 | 0 | 0 |
Breeding records by year
Average number of breeding records per period by breeding code| Period | Breeding (BLA code) | Carrying Food | Copulating | Display | Dependent young | Faecal sac | Inspecting hollow | Nest building | Nest with eggs | Nest with young | On/leaving nest |
|---|---|---|---|---|---|---|---|---|---|---|---|
| All years | |||||||||||
| All | 0.0 | 0.0 | 0.0 | 0.0 | 0.1 | 0.0 | 0.1 | 0.2 | 0.0 | 0.1 | 0.1 |
| Previous years | |||||||||||
| All previous years | 0.0 | 0.0 | 0.0 | 0.0 | 0.1 | 0.0 | 0.0 | 0.2 | 0.0 | 0.1 | 0.1 |
| Previous 30 years | 0.0 | 0.0 | 0.0 | 0.0 | 0.0 | 0.0 | 0.0 | 0.2 | 0.0 | 0.1 | 0.1 |
| Previous 20 years | 0.0 | 0.0 | 0.0 | 0.0 | 0.0 | 0.0 | 0.0 | 0.2 | 0.0 | 0.0 | 0.1 |
| 10 year groups | |||||||||||
| [2007,2017) | 0.0 | 0.0 | 0.0 | 0.1 | 0.1 | 0.0 | 0.1 | 0.3 | 0.0 | 0.1 | 0.3 |
| [1997,2007) | 0.0 | 0.0 | 0.0 | 0.0 | 0.0 | 0.0 | 0.0 | 0.1 | 0.0 | 0.0 | 0.0 |
| [1987,1997) | 0.0 | 0.0 | 0.0 | 0.0 | 0.0 | 0.0 | 0.0 | 0.3 | 0.1 | 0.3 | 0.0 |
| 5 year groups | |||||||||||
| [2012,2017) | 0.0 | 0.0 | 0.0 | 0.0 | 0.2 | 0.0 | 0.2 | 0.4 | 0.0 | 0.0 | 0.6 |
| [2007,2012) | 0.0 | 0.0 | 0.0 | 0.2 | 0.0 | 0.0 | 0.0 | 0.2 | 0.0 | 0.2 | 0.0 |
| [2002,2007) | 0.0 | 0.0 | 0.0 | 0.0 | 0.0 | 0.0 | 0.0 | 0.2 | 0.0 | 0.0 | 0.0 |
| [1997,2002) | 0.0 | 0.0 | 0.0 | 0.0 | 0.0 | 0.0 | 0.0 | 0.0 | 0.0 | 0.0 | 0.0 |
| [1992,1997) | 0.0 | 0.0 | 0.0 | 0.0 | 0.0 | 0.0 | 0.0 | 0.0 | 0.0 | 0.0 | 0.0 |
| [1987,1992) | 0.0 | 0.0 | 0.0 | 0.0 | 0.0 | 0.0 | 0.0 | 0.6 | 0.2 | 0.6 | 0.0 |
| Year | |||||||||||
| 2017 | 0.0 | 0.0 | 0.0 | 0.0 | 0.0 | 0.0 | 1.0 | 0.0 | 0.0 | 0.0 | 1.0 |
| 2016 | 0.0 | 0.0 | 0.0 | 0.0 | 1.0 | 0.0 | 0.0 | 0.0 | 0.0 | 0.0 | 0.0 |
| 2015 | 0.0 | 0.0 | 0.0 | 0.0 | 0.0 | 0.0 | 1.0 | 0.0 | 0.0 | 0.0 | 0.0 |
| 2014 | 0.0 | 0.0 | 0.0 | 0.0 | 0.0 | 0.0 | 0.0 | 2.0 | 0.0 | 0.0 | 2.0 |
| 2013 | 0.0 | 0.0 | 0.0 | 0.0 | 0.0 | 0.0 | 0.0 | 0.0 | 0.0 | 0.0 | 0.0 |
| 2012 | 0.0 | 0.0 | 0.0 | 0.0 | 0.0 | 0.0 | 0.0 | 0.0 | 0.0 | 0.0 | 1.0 |
| 2011 | 0.0 | 0.0 | 0.0 | 0.0 | 0.0 | 0.0 | 0.0 | 0.0 | 0.0 | 0.0 | 0.0 |
| 2010 | 0.0 | 0.0 | 0.0 | 0.0 | 0.0 | 0.0 | 0.0 | 0.0 | 0.0 | 0.0 | 0.0 |
| 2009 | 0.0 | 0.0 | 0.0 | 0.0 | 0.0 | 0.0 | 0.0 | 0.0 | 0.0 | 0.0 | 0.0 |
| 2008 | 0.0 | 0.0 | 0.0 | 1.0 | 0.0 | 0.0 | 0.0 | 0.0 | 0.0 | 1.0 | 0.0 |
| 2007 | 0.0 | 0.0 | 0.0 | 0.0 | 0.0 | 0.0 | 0.0 | 1.0 | 0.0 | 0.0 | 0.0 |
| 2006 | 0.0 | 0.0 | 0.0 | 0.0 | 0.0 | 0.0 | 0.0 | 1.0 | 0.0 | 0.0 | 0.0 |
| 2005 | 0.0 | 0.0 | 0.0 | 0.0 | 0.0 | 0.0 | 0.0 | 0.0 | 0.0 | 0.0 | 0.0 |
| 2004 | 0.0 | 0.0 | 0.0 | 0.0 | 0.0 | 0.0 | 0.0 | 0.0 | 0.0 | 0.0 | 0.0 |
| 2003 | 0.0 | 0.0 | 0.0 | 0.0 | 0.0 | 0.0 | 0.0 | 0.0 | 0.0 | 0.0 | 0.0 |
| 2002 | 0.0 | 0.0 | 0.0 | 0.0 | 0.0 | 0.0 | 0.0 | 0.0 | 0.0 | 0.0 | 0.0 |
| 2001 | 0.0 | 0.0 | 0.0 | 0.0 | 0.0 | 0.0 | 0.0 | 0.0 | 0.0 | 0.0 | 0.0 |
| 2000 | 0.0 | 0.0 | 0.0 | 0.0 | 0.0 | 0.0 | 0.0 | 0.0 | 0.0 | 0.0 | 0.0 |
| 1999 | 0.0 | 0.0 | 0.0 | 0.0 | 0.0 | 0.0 | 0.0 | 0.0 | 0.0 | 0.0 | 0.0 |
| 1998 | 0.0 | 0.0 | 0.0 | 0.0 | 0.0 | 0.0 | 0.0 | 0.0 | 0.0 | 0.0 | 0.0 |
| 1997 | 0.0 | 0.0 | 0.0 | 0.0 | 0.0 | 0.0 | 0.0 | 0.0 | 0.0 | 0.0 | 0.0 |
| 1996 | 0.0 | 0.0 | 0.0 | 0.0 | 0.0 | 0.0 | 0.0 | 0.0 | 0.0 | 0.0 | 0.0 |
| 1995 | 0.0 | 0.0 | 0.0 | 0.0 | 0.0 | 0.0 | 0.0 | 0.0 | 0.0 | 0.0 | 0.0 |
| 1994 | 0.0 | 0.0 | 0.0 | 0.0 | 0.0 | 0.0 | 0.0 | 0.0 | 0.0 | 0.0 | 0.0 |
| 1993 | 0.0 | 0.0 | 0.0 | 0.0 | 0.0 | 0.0 | 0.0 | 0.0 | 0.0 | 0.0 | 0.0 |
| 1992 | 0.0 | 0.0 | 0.0 | 0.0 | 0.0 | 0.0 | 0.0 | 0.0 | 0.0 | 0.0 | 0.0 |
| 1991 | 0.0 | 0.0 | 0.0 | 0.0 | 0.0 | 0.0 | 0.0 | 0.0 | 0.0 | 0.0 | 0.0 |
| 1990 | 0.0 | 0.0 | 0.0 | 0.0 | 0.0 | 0.0 | 0.0 | 0.0 | 0.0 | 0.0 | 0.0 |
| 1989 | 0.0 | 0.0 | 0.0 | 0.0 | 0.0 | 0.0 | 0.0 | 0.0 | 0.0 | 1.0 | 0.0 |
| 1988 | 0.0 | 0.0 | 0.0 | 0.0 | 0.0 | 0.0 | 0.0 | 2.0 | 1.0 | 2.0 | 0.0 |
| 1987 | 0.0 | 0.0 | 0.0 | 0.0 | 0.0 | 0.0 | 0.0 | 1.0 | 0.0 | 0.0 | 0.0 |
| 1986 | 0.0 | 0.0 | 0.0 | 0.0 | 1.0 | 0.0 | 0.0 | 0.0 | 0.0 | 0.0 | 0.0 |
| 1985 | 0.0 | 0.0 | 0.0 | 0.0 | 0.0 | 0.0 | 0.0 | 0.0 | 0.0 | 0.0 | 0.0 |
| 1984 | 0.0 | 0.0 | 0.0 | 0.0 | 0.0 | 0.0 | 0.0 | 0.0 | 0.0 | 0.0 | 0.0 |
| 1983 | 0.0 | 0.0 | 0.0 | 0.0 | 0.0 | 0.0 | 0.0 | 0.0 | 0.0 | 0.0 | 0.0 |
| 1982 | 0.0 | 0.0 | 0.0 | 0.0 | 0.0 | 0.0 | 0.0 | 0.0 | 0.0 | 0.0 | 0.0 |
Distribution map
Distribution - 2017
This map shows the observed distribution of the Whistling Kite for 2017.
The red circles are the grid cells where Whistling Kite have been reported.
The transparency of the red circles indicate how many surveys sheets were submitted for that grid cell; the darker the red the more reliable the data. Of the 315 grid cells with reports, 83 had only one sheet; an example is grid number V2.
The size of the circle represents the reporting rate. The maximum reporting rate for Whistling Kite was 100.0% (eg grid number V2) and the minimum was 0.1% (eg grid number J14). 
Distribution - all years
This map shows the observed distribution of the Whistling Kite for all years.
The red circles are the grid cells where Whistling Kite have been reported.
The transparency of the red circles indicate how many surveys sheets were submitted for that grid cell; the darker the red the more reliable the data. Of the 703 grid cells with reports, 55 had only one sheet; an example is grid number A12.
The size of the circle represents the reporting rate. The maximum reporting rate for Whistling Kite was 50.0% (eg grid number B6) and the minimum was 0.0% (eg grid number K15). 
Breeding map
Breeding - 2017
This map shows the breeding distribution of the Whistling Kite for 2017.
The red circles are the grid cells where breeding activity for Whistling Kite have been reported.
The size of the circle represents the number of reports. 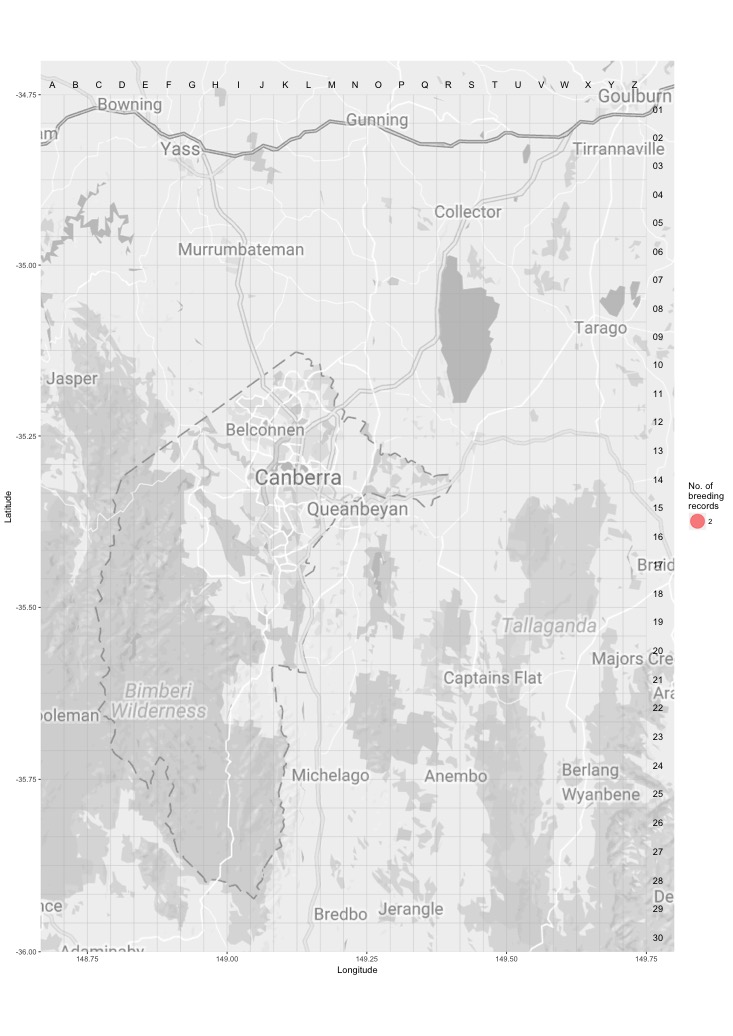
Breeding - all years
This map shows the breeding distribution of the Whistling Kite for all years.
The red circles are the grid cells where breeding activity for Whistling Kite have been reported.
The size of the circle represents the number of reports. 